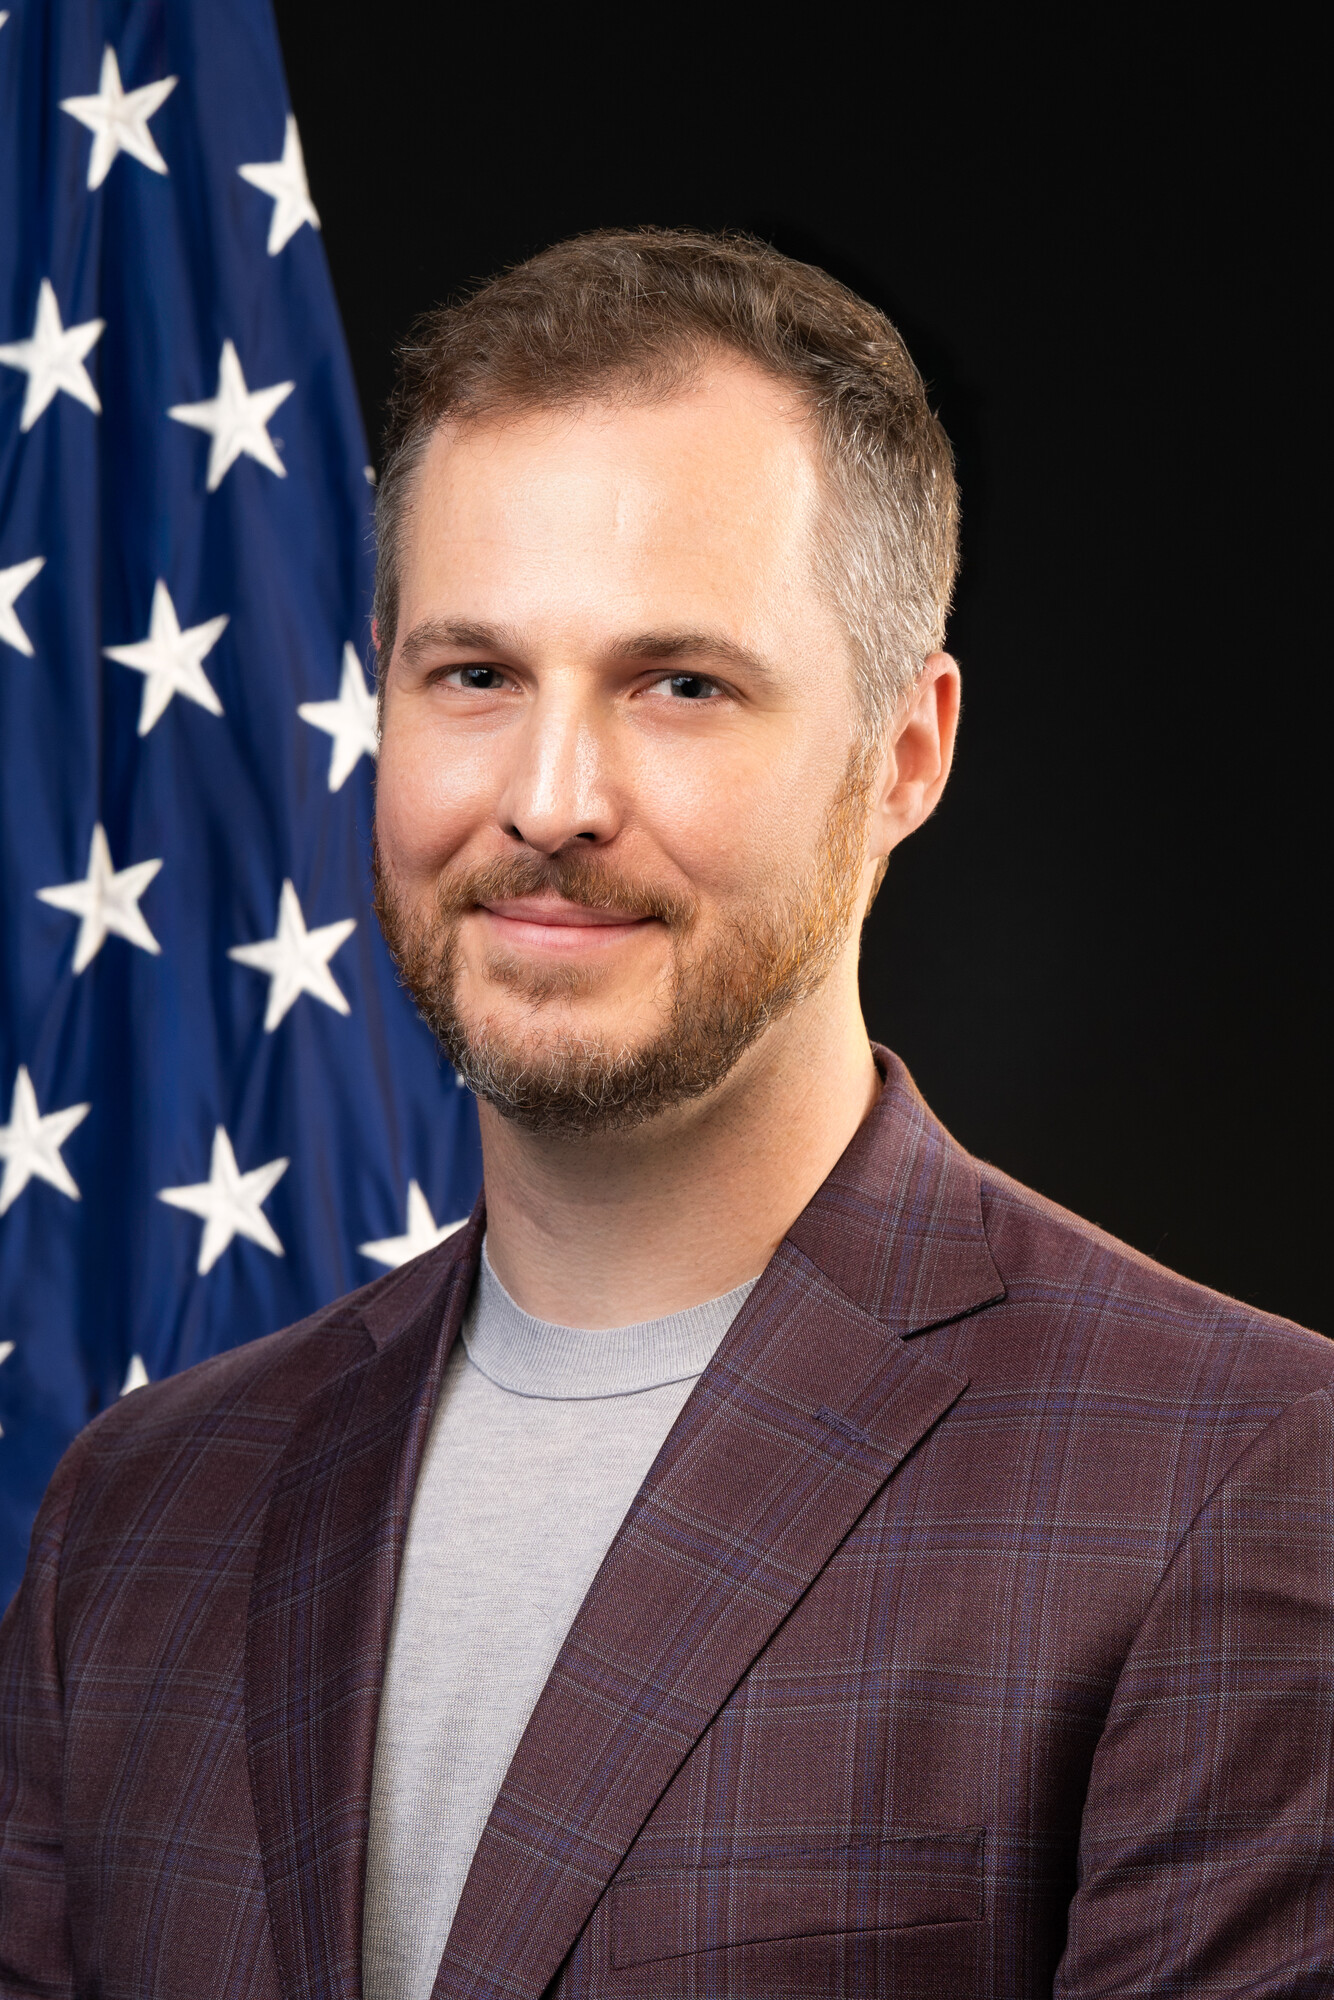
On today's episode, CDC's Jason Asher joins us to explain how new data tools are transforming detection and response to infectious diseases.

 Spotify
 Apple Podcasts
 Amazon Music
 What if public health could predict outbreaks the way we predict the weather? In this episode, Jason Asher, director of the Center for Forecasting and Outbreak Analytics at the CDC, joins us to explain how a new generation of data tools is transforming how we detect and respond to infectious diseases. For decades, public health has relied on lagging data telling us what has already happened. Asher and his team are working to change that, building systems that turn real-time data streams into actionable forecasts, simulations, and decision-making tools for health departments across the country. We dive into how these tools are already being used, from measles outbreak modeling in South Carolina to national “nowcasting” systems that fill in data gaps in real time.
Modeling Handbook | CFA: Modeling and Forecasting | CDC
Learning Resources | CFA | CDC
epiENGAGE Measles Outbreak Simulator v-2.6.0
Current Epidemic Trends (Based on Rt) for States | CFA: Modeling and Forecasting | CDC
Respiratory Virus Hospitalization Surveillance Network (RESP-NET) | RESP-NET | CDC
Measles Outbreak Simulator | CFA: Modeling and Forecasting | CDC
2025-2026 Respiratory Disease Season Outlook - December Update | CFA: Qualitative Assessments | CDC
Past, Present, and Future: Reflections from a Radiation Readiness Professional

JOHN SHEEHAN:
This is Public Health Review Morning Edition for Tuesday, March 31, 2026. I’m John Sheehan with news from the Association of State and Territorial Health Officials.
Today: How CDC is using a new generation of data tools to forecast the next outbreak and is transforming how we detect and respond to infectious diseases. Jason Asher, director of the Center for Forecasting and Outbreak Analytics at the CDC, joins us to explain how, for decades, public health has relied on lagging data telling us what already happened. But now, Asher and his team are building systems that turn real-time data streams into actionable forecasts, simulations, and decision-making tools for health departments across the country.
Jason Asher, welcome to the show.
JASON ASHER:
Glad to be here, thanks for having me.
SHEEHAN:
So, Jason, what is the Center for Forecasting and Outbreak Analytics?
ASHER:
Yeah, so I invite you to consider just how much, on a daily basis, we each rely on predictions to make decisions. When was the last time you drove somewhere far away without using a navigation app? It's probably been a while, because you rely on it to adjust your route and departure to make sure you arrive on time. Imagine you're packing for travel in the week ahead. You'd almost certainly check the weather forecast for your destination. Perhaps you'll need some warmer clothes or a raincoat. If you buy something online, you likely use the anticipated delivery date as a factor in your decision. Each of these are examples of predictive analytics. They help us anticipate what's coming and make better decisions about our time and resources. But historically, public health systems weren't built that way. They were designed to tell us what has already happened, not necessarily what is about to happen next. That means many high-stakes decisions during outbreaks are made using incomplete or delayed data. So at the Center for Forecasting and Outbreak Analytics, we're working to change that. Our goal is to close a few key gaps, moving from lagged data to real-time signals from static reports to interactive decision tools, and from broad averages to insights that help guide action closer to where outbreaks are actually happening. One reason the federal government can play a role here is that we're able to bring together multiple streams of data that aren't available in any one place at the state or local level. And when we combine those signals, we can generate forecasts, models, and simulations that give a clearer picture of where things may be headed. And we see this work as returning something of value to the state and local health departments and increasingly healthcare systems that are sharing data with CDC. So, the goal is to turn that data into insights that support the decisions they are making every day. CFA is working towards a future where a state health department can see early signals that an outbreak may be accelerating in a particular region and where a hospital system can anticipate a surge in respiratory illness before it arrives so that it can adjust staffing and other resources ahead of time. When we set up CFA just a few years ago, we were essentially starting from scratch, but we've made significant progress in a short time. And the capabilities I'm talking about aren't decades away. With sustained effort, this kind of predictive insight could become a routine part of public health and health system decision-making within the next few years.
SHEEHAN:
Jason, that's incredible. And as you sort of described, the implications for it are so immense, as you described, being able to take data streams from across the nation. What kinds of things are you working on now at the center? And what's top of mind?
ASHER:
Yeah, so let me share a few examples of the work we're doing right now. One place this work is already making a difference is in measles outbreak response. So, we've been working directly with states that are responding to measles outbreaks. For example, in South Carolina, we've been partnering closely with the state health department to better understand how the outbreak is evolving and where it may be headed. We recently completed what we call a scenario assessment for that outbreak. In plain terms, instead of predicting a single outcome, we lay out several plausible paths the outbreak could take depending on things like vaccination coverage and the strength of intervention measures. That kind of analysis gives leaders a way to step back from the day-to-day response and think more strategically about where the outbreak may be headed. And importantly, we're turning what we learn from working closely with individual states into tools that others can use, whether they're preparing for a potential outbreak or actively responding to one. So, alongside supporting individual jurisdictions, we're also working to make modeling more accessible. One example is our interactive measles simulator. It's web browser-based, so you don't need specialized software or a background in modeling to use it. The simulator lets health departments explore what-if scenarios for their own communities. They can adjust things like vaccination coverage or how quickly cases are identified or how well isolation guidance is followed, and then see how those changes might affect the size or duration of an outbreak. That kind of rapid exploration can be especially helpful early in an outbreak when decisions need to move quickly, and information is still evolving. Stepping back, health departments also tell us that they need tools to help them understand what's happening right now and where things may be headed next. There's two capabilities we're expanding there, now casting an RT estimation. These tools help answer two fundamental questions during an outbreak. What's happening right now, and is transmission increasing or decreasing? So, let me start with ‘nowcasting.’ Simply put, nowcasting means estimating what's happening right now even before all the data have been fully reported. Because reporting delays are common, the most recent numbers are often incomplete. Nowcasting helps fill those gaps so decision makers don't have to wait days or weeks for a clearer picture of current conditions. For example, we've been working with state officials in South Carolina to develop nowcasted estimates during the measles outbreak there, sharing updates one to two times a week throughout the outbreak. We've also integrated now-casting into national surveillance systems like RespNet to improve the timeliness of available hospitalization data for respiratory illnesses. The goal is straightforward: to reduce blind spots during fast-moving situations. And there's another benefit. When we begin with a more accurate picture of what's happening right now, other modeling work becomes more reliable. So, better understanding today leads to better decisions tomorrow. Another tool we've been expanding is something called RT, or the Time Varying Effective Reproductive Number. Plainly speaking, RT tells us how quickly infections are spreading, somewhat like a speedometer in a car. RT can tell us whether infections are increasing, decreasing, or staying the same. Used alongside forecasts and surveillance data, RT gives a quick read on transmission trends. So, just a couple of years ago, routine state-level RT estimates weren't widely available. Now, today, we produce weekly state-level estimates for COVID-19 and during the respiratory season for influenza and RSV as well. But the next step is increasing geographic detail, moving towards sub-state or county-level estimates. For jurisdictions, that means more localized insight into where transmission may be accelerating, so decisions about outreach and interventions can be more precisely targeted.
SHEEHAN:
It sounds almost like a weather forecasting map, but for diseases for the country.
ASHER:
Yeah, that's right. think the metaphor of making infectious disease forecasting as commonplace as weather prediction. That's a major goal of ours.
SHEEHAN:
And obviously, it sounds, as you describe it, to be such a useful array of tools that it makes complete sense that agencies would use them. Do you develop them in concert with member organizations, member agencies?
ASHER:
Yes, so our tools only have impact if they work for decision-makers, especially state and local public health leaders. So, that's why we actively seek feedback from state, territorial, local, and tribal partners, often in collaboration with ASTHO and other public health networks. For example, last spring, more than 140 public health professionals shared feedback on our respiratory disease season outlook, an early assessment designed to give health leaders a sense of what might be coming during respiratory season. You told us that understanding combined hospital demand for COVID-19, RSV, and influenza during the fall and winter was the most useful piece of information. So this year, we made that prediction more prominent in the outlook, including in the final update that we released earlier this month. You also asked for RT estimates for RSV and more plain language interpretation of what those numbers mean. So, we built that capability. Now we're working on the next request, more localized insights at the sub-state level, and partnering with states like New Mexico to evaluate how useful these estimates are during the earliest stages of an outbreak. We're also improving the measles simulator that I mentioned earlier based on early user feedback. A new version released last month includes a baseline immunity calculator, the ability to model smaller populations, and downloadable results for planning discussions. These updates are based directly on feedback from state and local partners. They didn't just come from sitting in a room; they came directly from people who may be listening to the podcast right now, telling us what would make tools more useful in real-world decision-making. This kind of feedback loop is critical. It directly shapes our priorities. We regularly ask, when it comes to infectious disease response, what decisions are the hardest to make right now? And what information would make those decisions easier? Modeling, forecasting, and simulation should support real-world decision-making, not operate separately.
SHEEHAN:
And are you finding that agencies now getting to use these tools are finding their operations opened up that they can increase their capacity now, thanks to these more efficient tools?
ASHER:
Yeah, so, one of the most significant ways we support state and local health departments is through InsightNet, which is CFA's national network of innovation hubs. It includes nearly 130 partners across 30 states spanning the academic, public, and private sectors. So, through InsightNet, we're developing new forecasting and modeling tools while also helping to build that capacity you mentioned within state and local public health departments to identify and respond to outbreaks earlier. Across the network, Partners are building tools that help health departments understand vaccination coverage, identify outbreak risk, and simulate how diseases might spread in their communities. So, some examples are Clemson supporting the ongoing measles outbreak response in South Carolina with real-time modeling and weekly situational updates. School-level vaccination dashboards developed by UNC for North Carolina. National risk mapping tools developed by Johns Hopkins and localized outbreak simulators used by cities like Austin, Texas, just to name a few. But we've also heard clearly that building tools alone isn't enough. Health departments want support in understanding how to apply them and confidence in using them. So we've also focused on creating plain language resources designed specifically for public health professionals who may not have formal training in modeling. One example is our modeling handbook, which explains what different types of models do, how they work, and how to interpret their results. We also publish practical guides and short explainers through our Behind the Model series, where we walk through how our forecasting and modeling methods work in plain language. The goal across all of this work is to make modeling information easier to understand, easier to access, and easier to use. Because capacity building isn't just about developing new tools, it's about making sure people feel equipped and confident using them in real-world decision-making.
SHEEHAN:
And Jason, you mentioned that it's only been in the last few years that these data streams have been able to be compiled and open up these new insights. What do you see moving forward as computing power gets stronger and more and more data streams open up?
ASHER:
Yeah, so we see a future where disease forecasting is faster, more localized, and easier to integrate into everyday public health work. In many ways, we think about this, like I said earlier, like weather forecasting. It's not just about high-performing predictions. It's about giving you advance notice so you can prepare, providing insights specific to your community, and updating information in real time as conditions change. Looking ahead, our focus is on making updates more timely, increasing geographic detail, expanding coverage across multiple pathogens, and continuing to strengthen partnerships with states, territories, and local health departments. But the goal isn't sophistication for its own sake. It's really usability, tools that fit into real-world situations and help you act earlier and more confidently. As we talked about earlier, predictive tools are already a part of how we make decisions in everyday life. We're working towards bringing that same kind of anticipatory insight to public health. When health departments and healthcare systems can see earlier signs of where outbreaks may be headed, they can plan ahead and take more precise action, adjusting interventions, staffing, and other resources. Our goal is to make modeling, forecasting, and simulation a routine part of public health decision-making so that all of us can see what's coming and act earlier to protect our communities.
SHEEHAN:
Jason Asher, thanks so much.
ASHER:
John, thank you as well. It was great to be here with you.
SHEEHAN:
Jason Asher is director of the Center for Forecasting and Outbreak Analytics at the CDC.
Pull up a chair and join ASTHO for a ‘fireside chat’ with a subject matter expert in radiation readiness communications, Jessica Wieder. In this webinar titled, “Past, Present, and Future: Reflections from a Radiation Readiness Professional,” Ms. Wieder will share reflections on her career and insights from her experience in radiological preparedness and emergency communications. This webinar will include discussions around key considerations for effective radiological risk communication from a public health preparedness perspective, including coordinating messages across partners and addressing public concern and false and misleading information. Find a link to the webinar in the show notes.
The Public Health Infrastructure Grant (PHIG) is driving progress in strengthening public health systems nationwide. Want to stay in the loop? The PHIG National Partners Connections newsletter is your one-stop source for funding and engagement opportunities, program updates and success stories, events, training and webinars, tools, resources, and more. Subscribe now at the link in the show notes and stay connected to the national conversation shaping the future of public health.
This has been Public Health Review Morning Edition. I’m John Sheehan for the Association of State and Territorial Health Officials.